Analyzing network rail performance in Power BI
This was an entry I submitted to the Maven Analytics Rail challenge, coming 4th place in popular vote. You can view the original submission here.
The challenge was to (1) identify the most popular routes, (2) determine peak travel times, (3) analyze revenue from different ticket types & classes, and (4) diagnose on-time performance and contributing factors.
I created a report that had 5 pages;
- Executive Summary
- Revenue Analysis
- Route Analysis
- Travel Time Analysis
- Delay & Cancellation Impact
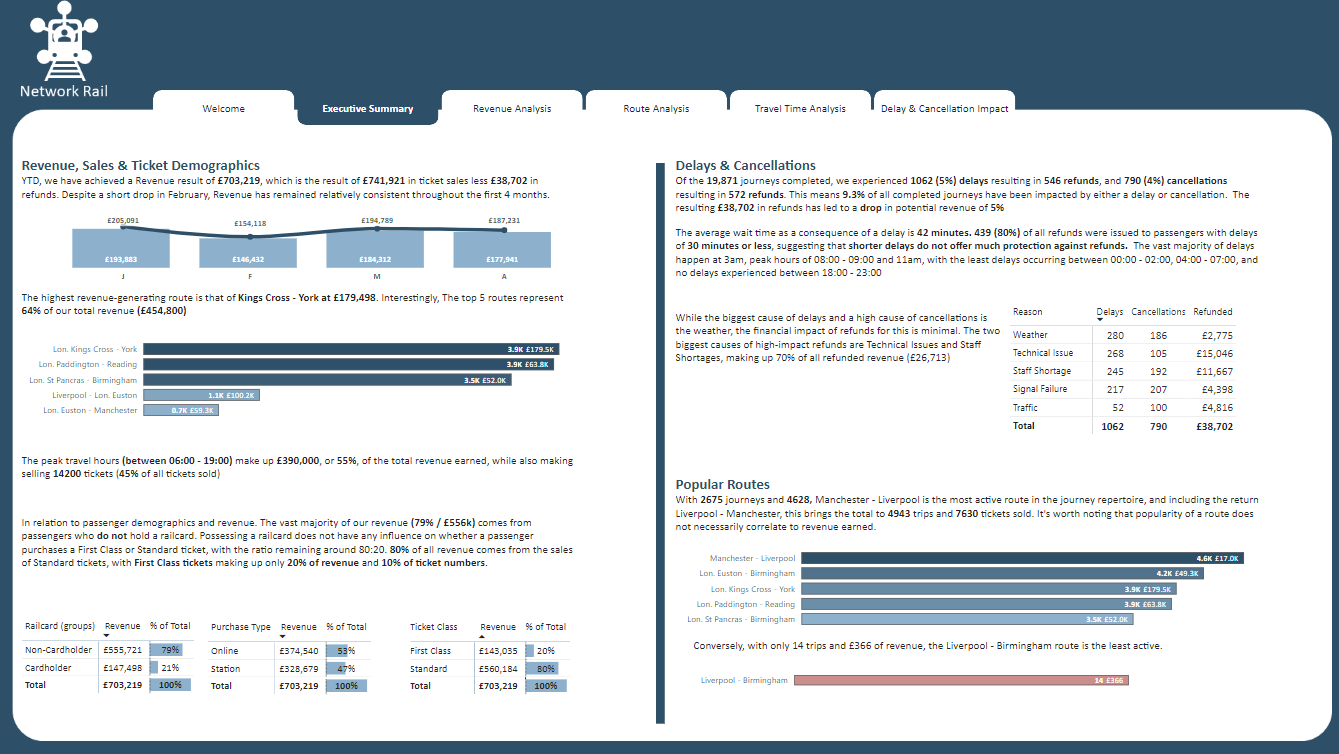
The Executive Summary provides an overview of the core metrics, as well as detailed explanations of what the data was showing for Q1 data (the extent of the dataset for the challenge).

The Executive Summary shows:
- Revenue YTD (net ticket sales minus refunds)
- Top route by revenue, and pareto-style analysis of top 5 routes
- Peak travel time, bucketed by hour, and % of total revenue by this bucket
- Revenue (and % of total) by customer demographics available: cardholder-status, first class/standard, and where the ticket was purchased
- Detailed information on delays and cancellations, split out across time periods and factoring in causes for delays/cancellations, as well as amounts refunded
[…] more to follow

Leave a Reply