Analysing global surface temperatures over time in SQL
Global land surface temperatures are a critical indicator of climate change and environmental health. By analyzing historical temperature data, we can uncover trends, identify anomalies, and gain insights into the impacts of global warming on different regions. In this post, I will explore some ways to perform analyses on this type of data. The dataset was downloaded from Kaggle here, provided by Masood Ahmed.
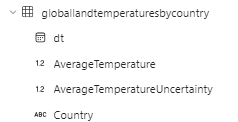
The first CSV I’m using is ‘globallandtemperaturesbycountry.csv’, which has the following schema;

Some questions we might want to ask of this data are:
1) Which months are the hottest and coldest?
2) Which countries are the hottest and coldest?
3) Which were the hottest and coldest periods?
4) What do the overall trends suggest?
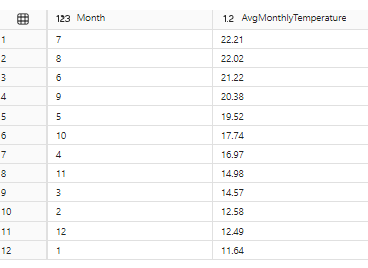
Let’s start simple by looking at the aggregate average temperature by month across all years and countries. We can see that the hottest three months of the year (to nobody’s surprise) are July, August and June, while the three coldest are January, December and February.
SELECT
    MONTH([dt]) AS Month,
    ROUND(AVG([AverageTemperature]), 2) AS AvgMonthlyTemperature
FROM
    [LH_Raw].[dbo].[globallandtemperaturesbycountry]
GROUP BY
    MONTH([dt])
ORDER BY
    AvgMonthlyTemperature DESC;
Before drilling down to a more granular level, there are still some interesting overall aggregate data we could take a look at.
-- Step 1: Calculate average temperature for each 25-year bucket and assign row numbers for median calculation
WITH AvgTemperatures AS (
    SELECT
        (YEAR([dt]) / 25) * 25 AS YearBucketStart,
        AVG([AverageTemperature]) AS AvgTemperature,
        ROW_NUMBER() OVER (PARTITION BY (YEAR([dt]) / 25) * 25 ORDER BY AVG([AverageTemperature])) AS RowAsc,  --
        COUNT(*) OVER (PARTITION BY (YEAR([dt]) / 25) * 25) AS TotalCount
    FROM
        [LH_Raw].[dbo].[globallandtemperaturesbycountry]
    GROUP BY
        (YEAR([dt]) / 25) * 25, [Country]
),

-- Step 2: Calculate the Min, Max, and Median temperatures for each 25-year bucket
MedianTemperatures AS (
    SELECT
        YearBucketStart,
        ROUND(MIN(AvgTemperature), 2) AS MinAvgTemperature,
        ROUND(MAX(AvgTemperature), 2) AS MaxAvgTemperature,
        ROUND(CASE
            WHEN TotalCount % 2 = 1 THEN
                MAX(CASE WHEN RowAsc = (TotalCount + 1) / 2 THEN AvgTemperature END)
            ELSE
                AVG(CASE WHEN RowAsc IN ((TotalCount / 2), (TotalCount / 2) + 1) THEN AvgTemperature END)
        END, 2) AS Median
    FROM
        AvgTemperatures
    GROUP BY
        YearBucketStart, TotalCount
),

-- Step 3: Calculate previous period's Min, Max, and Median temperatures
FinalQuery AS (
    SELECT
        YearBucketStart,
        MinAvgTemperature,
        MaxAvgTemperature,
        Median,
        LAG(MinAvgTemperature) OVER (ORDER BY YearBucketStart) AS PreviousMin,
        LAG(MaxAvgTemperature) OVER (ORDER BY YearBucketStart) AS PreviousMax,
        LAG(Median) OVER (ORDER BY YearBucketStart) AS PreviousMedian
    FROM
        MedianTemperatures
)

-- Step 4: Calculate the difference between the current and previous periods
SELECT
    YearBucketStart,
    MinAvgTemperature,
    MaxAvgTemperature,
    Median,
    ROUND((Median - ISNULL(PreviousMedian, Median)), 2) AS VsPrevMed,
    ROUND((MinAvgTemperature - ISNULL(PreviousMin, MinAvgTemperature)), 2) AS VsPrevMin,
    ROUND((MaxAvgTemperature - ISNULL(PreviousMax, MaxAvgTemperature)), 2) AS VsPrevMax
FROM
    FinalQuery
ORDER BY
    YearBucketStart;

In the ‘AvgTemperatures’ CTE, I’ve grouped the data into 25-year buckets to make it easier to manage. Within each bucket, the avg temp is calculated per country. Then, a sequential number is assigned to each row for calculating the median, and COUNT() determines total rows in each bucket (which is necessary for handling even and odd row counts). Then, in the ‘MedianTemperatures’ CTE I’ve calculated the min, max and med of AvgTemperature for each 25-year period conditionally, adjusting for even and odd row counts using window functions. The ‘FinalQuery’ CTE retrieves the previous period’s min, max and median values using LAG().
Looking briefly at the output, it generally suggests a warming trend over the last 300 years, with both median and maximum temperatures increasing. Fluctuations in minimum temperatures might suggest more variability in colder periods. The relatively smaller changes in the more recent periods might indicate that the rate of change is stabilizing, but it remains upward nevertheless.
The next analysis is looking at countries by hottest and coldest temperature. For ease, I’ve continued with the 25-year buckets.
WITH YearlyAvgTemp AS (
    SELECT
        YEAR([dt]) AS Year,
        [Country],
        ROUND(AVG([AverageTemperature]), 2) AS AvgYearlyTemperature
    FROM
        [LH_Raw].[dbo].[globallandtemperaturesbycountry]
    WHERE
        [AverageTemperature] IS NOT NULL
    GROUP BY
        YEAR([dt]), [Country]
),
BucketizedTemps AS (
    SELECT
        Year,
        Country,
        AvgYearlyTemperature,
        (Year / 25) * 25 AS YearBucket
    FROM
        YearlyAvgTemp
),
RankedBucketizedTemps AS (
    SELECT
        YearBucket,
        Country,
        AvgYearlyTemperature,
        ROW_NUMBER() OVER (PARTITION BY YearBucket ORDER BY AvgYearlyTemperature DESC) AS HighTempRank,
        ROW_NUMBER() OVER (PARTITION BY YearBucket ORDER BY AvgYearlyTemperature ASC) AS LowTempRank
    FROM
        BucketizedTemps
)
SELECT
    YearBucket,
    MAX(CASE WHEN HighTempRank = 1 THEN Country END) AS HottestCountry,
    MAX(CASE WHEN HighTempRank = 1 THEN ROUND(AvgYearlyTemperature, 2) END) AS HottestTemperature,
    MAX(CASE WHEN LowTempRank = 1 THEN Country END) AS ColdestCountry,
    MAX(CASE WHEN LowTempRank = 1 THEN ROUND(AvgYearlyTemperature, 2) END) AS ColdestTemperature
FROM
    RankedBucketizedTemps
GROUP BY
    YearBucket
ORDER BY
    YearBucket;
Djibouti appears frequently as the hottest country in multiple 25-year periods, while Greenland is consistently the coldest country across the periods. I would like to explore the temporal changes in temperature across these two countries a little more:
WITH YearlyAvgTemp AS (
    SELECT
        YEAR([dt]) AS Year,
        [Country],
        AVG([AverageTemperature]) AS AvgYearlyTemperature,
        MIN([AverageTemperature]) AS MinYearlyTemperature,
        MAX([AverageTemperature]) AS MaxYearlyTemperature
    FROM
        [LH_Raw].[dbo].[globallandtemperaturesbycountry]
    WHERE
        [AverageTemperature] IS NOT NULL
        AND [Country] IN ('Greenland', 'Djibouti')
    GROUP BY
        YEAR([dt]), [Country]
),
BucketizedTemps AS (
    SELECT
        Year,
        Country,
        AvgYearlyTemperature,
        MinYearlyTemperature,
        MaxYearlyTemperature,
        (Year / 25) * 25 AS YearBucket
    FROM
        YearlyAvgTemp
),
AggregatedTemps AS (
    SELECT
        YearBucket,
        Country,
        ROUND(AVG(AvgYearlyTemperature), 2) AS AvgTemperature,
        ROUND(MIN(MinYearlyTemperature), 2) AS MinTemperature,
        ROUND(MAX(MaxYearlyTemperature), 2) AS MaxTemperature
    FROM
        BucketizedTemps
    GROUP BY
        YearBucket, Country
),
AggregatedWithChange AS (
    SELECT
        YearBucket,
        Country,
        AvgTemperature,
        LAG(AvgTemperature) OVER (PARTITION BY Country ORDER BY YearBucket) AS PrevAvgTemperature,
        MinTemperature,
        MaxTemperature
    FROM
        AggregatedTemps
)
SELECT
    YearBucket,
    Country,
    AvgTemperature,
    ROUND(AvgTemperature - PrevAvgTemperature, 2) AS ChangeFromPrevPeriod,
    MinTemperature,
    MaxTemperature
FROM
    AggregatedWithChange
ORDER BY
    YearBucket, Country;
Djibouti’s average temperature shows a general upward trend, with the more significant increases happening in the later periods; min and max temperatures reflect this trend. Greenland’s average temperature fluctuates but also shows a notable warming trend in recent periods. The minimum temperatures remain consistently low, but there are also periods of slight warming.
Succinctly, the overarching trend across all analyses is an increase in global surface temperatures over the last 300 years.

Leave a Reply